Validation you can check yourself.
The hardware does not exist yet. What is validated today is the physics and the design, in simulation, end to end. Every number on this page is reproducible: the figures below come from open code and pinned data, and the SDK that powers them is on PyPI right now. We would rather find our own hard numbers than have a reviewer find them for us.
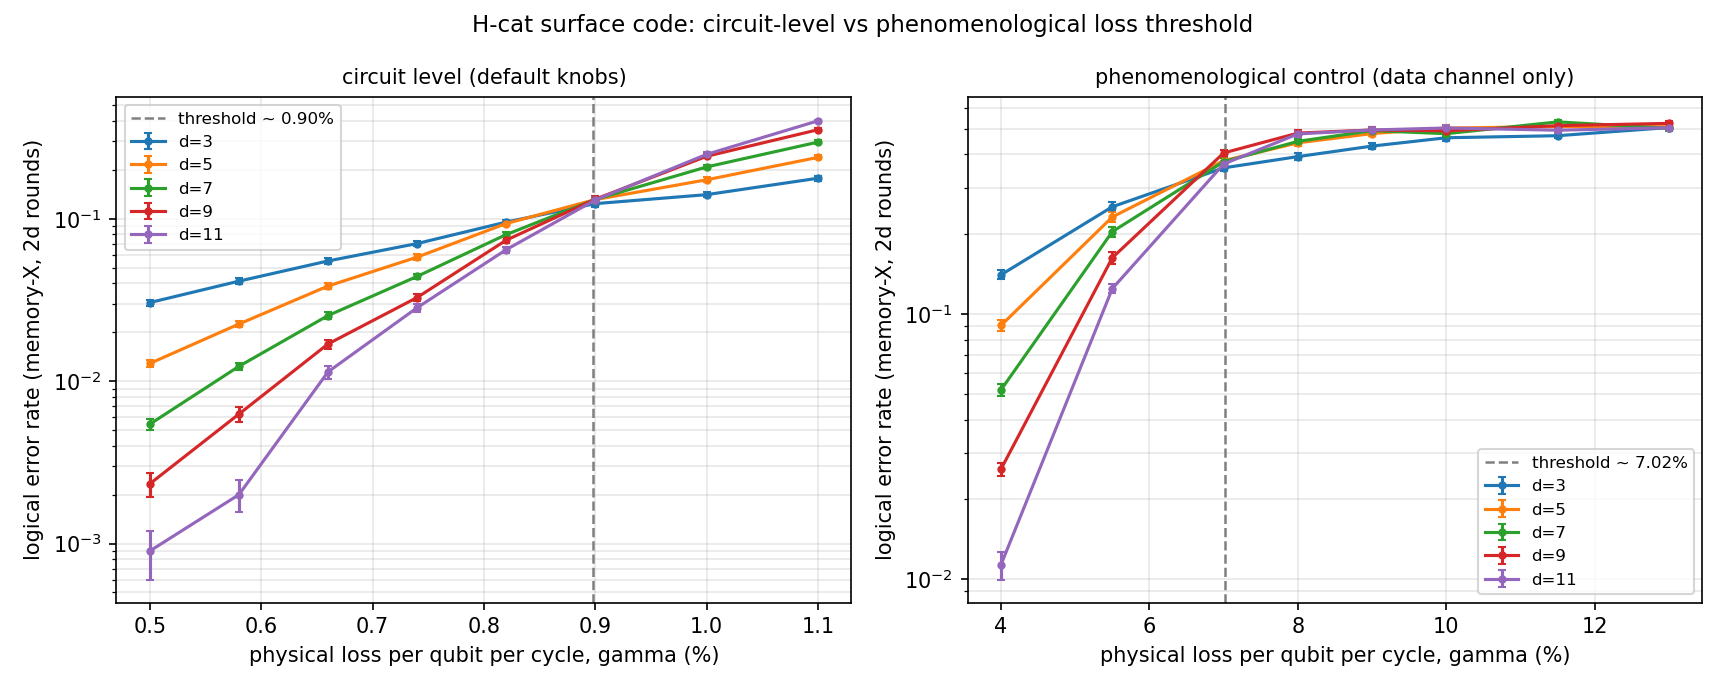
Fault-tolerance threshold, full circuit-level noise
Under realistic circuit-level noise, with noisy syndrome extraction decoded by stim and PyMatching, the surface-code logical error rate crosses at 0.79 to 0.90 percent loss per cycle. The right panel is the easier phenomenological control, shown for contrast: the circuit-level number is the honest, harder one. We operate the machine at 0.4 to 0.5 percent per cycle to keep margin below it. Finding our own harder threshold before a reviewer did is the entire point of running the full noise model.
Independent cross-check, two codebases
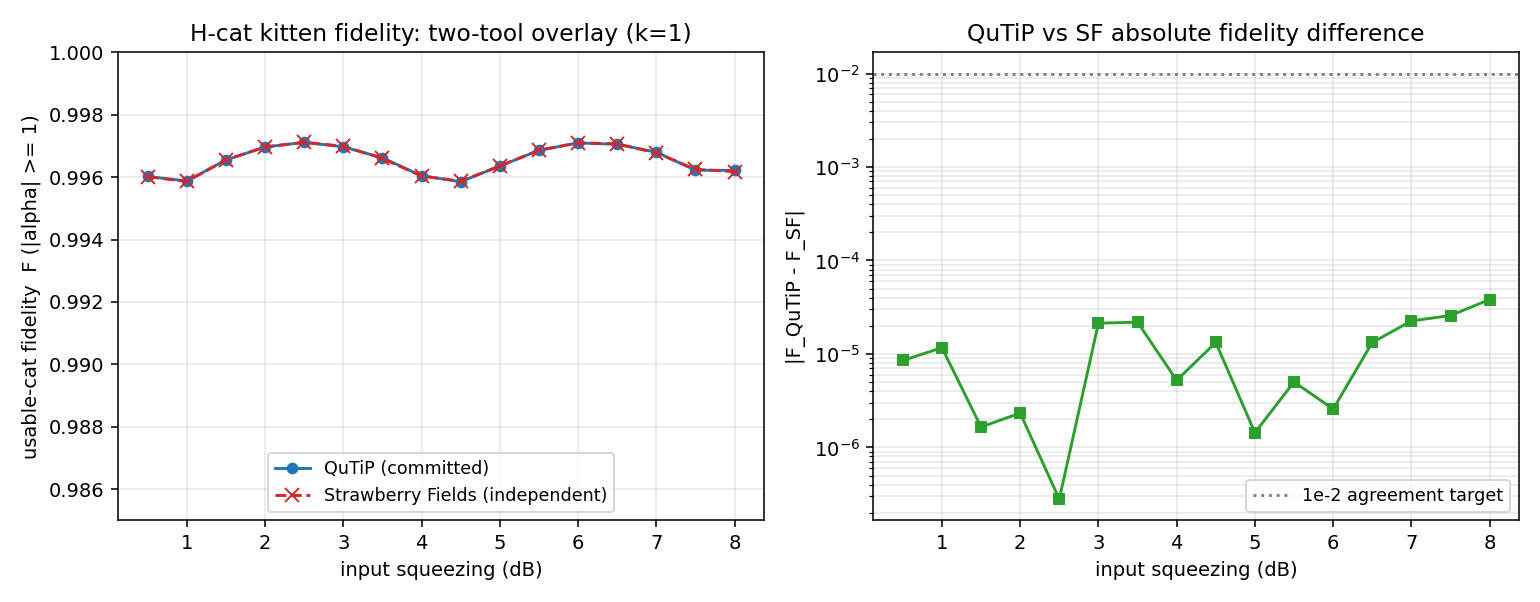
Cat fidelity computed two ways: once in QuTiP, once in a fully independent Strawberry Fields implementation. The two agree to about 1e-5, far inside the 1e-2 target. This is independent reproduction across separate quantum-optics stacks, not a single-codebase claim that could hide a shared bug. When two unrelated tools land on the same number, the number is real.
Manufacturability, 3D EM + fabrication Monte Carlo
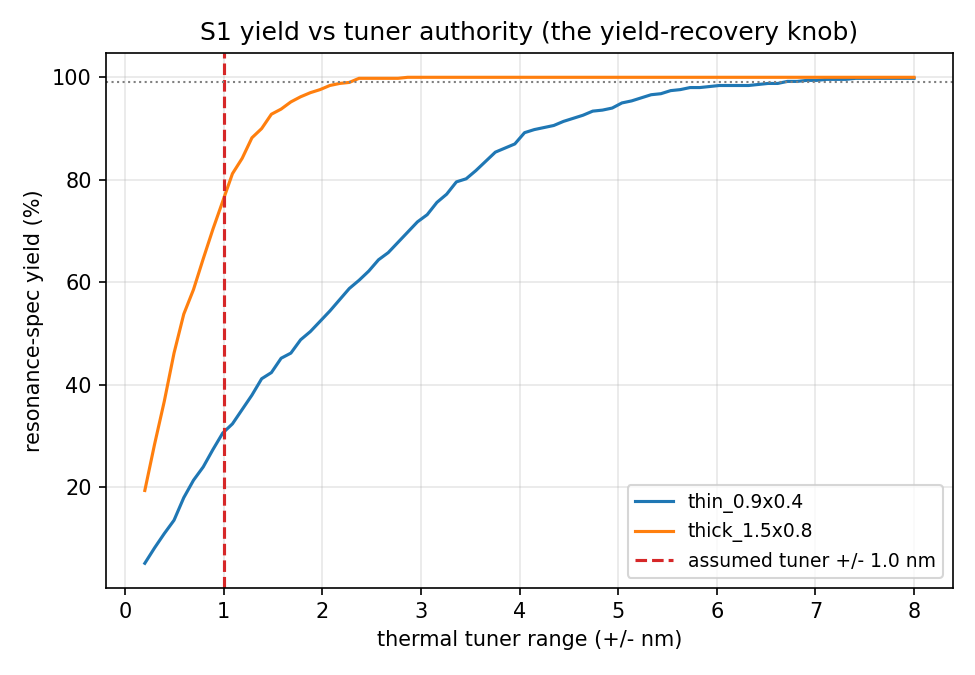
A 3D electromagnetic model fed through a fabrication Monte Carlo predicts resonance-spec yield of about 99 percent once the thermal tuners have +/- 2 to 3 nm of authority on the thick film. The key design finding: the yield-recovery knob is tuner range, not tighter lithography. You buy yield with control authority you already have, not with a process node you do not.
Tapeout-grade test chip, QF-TC1
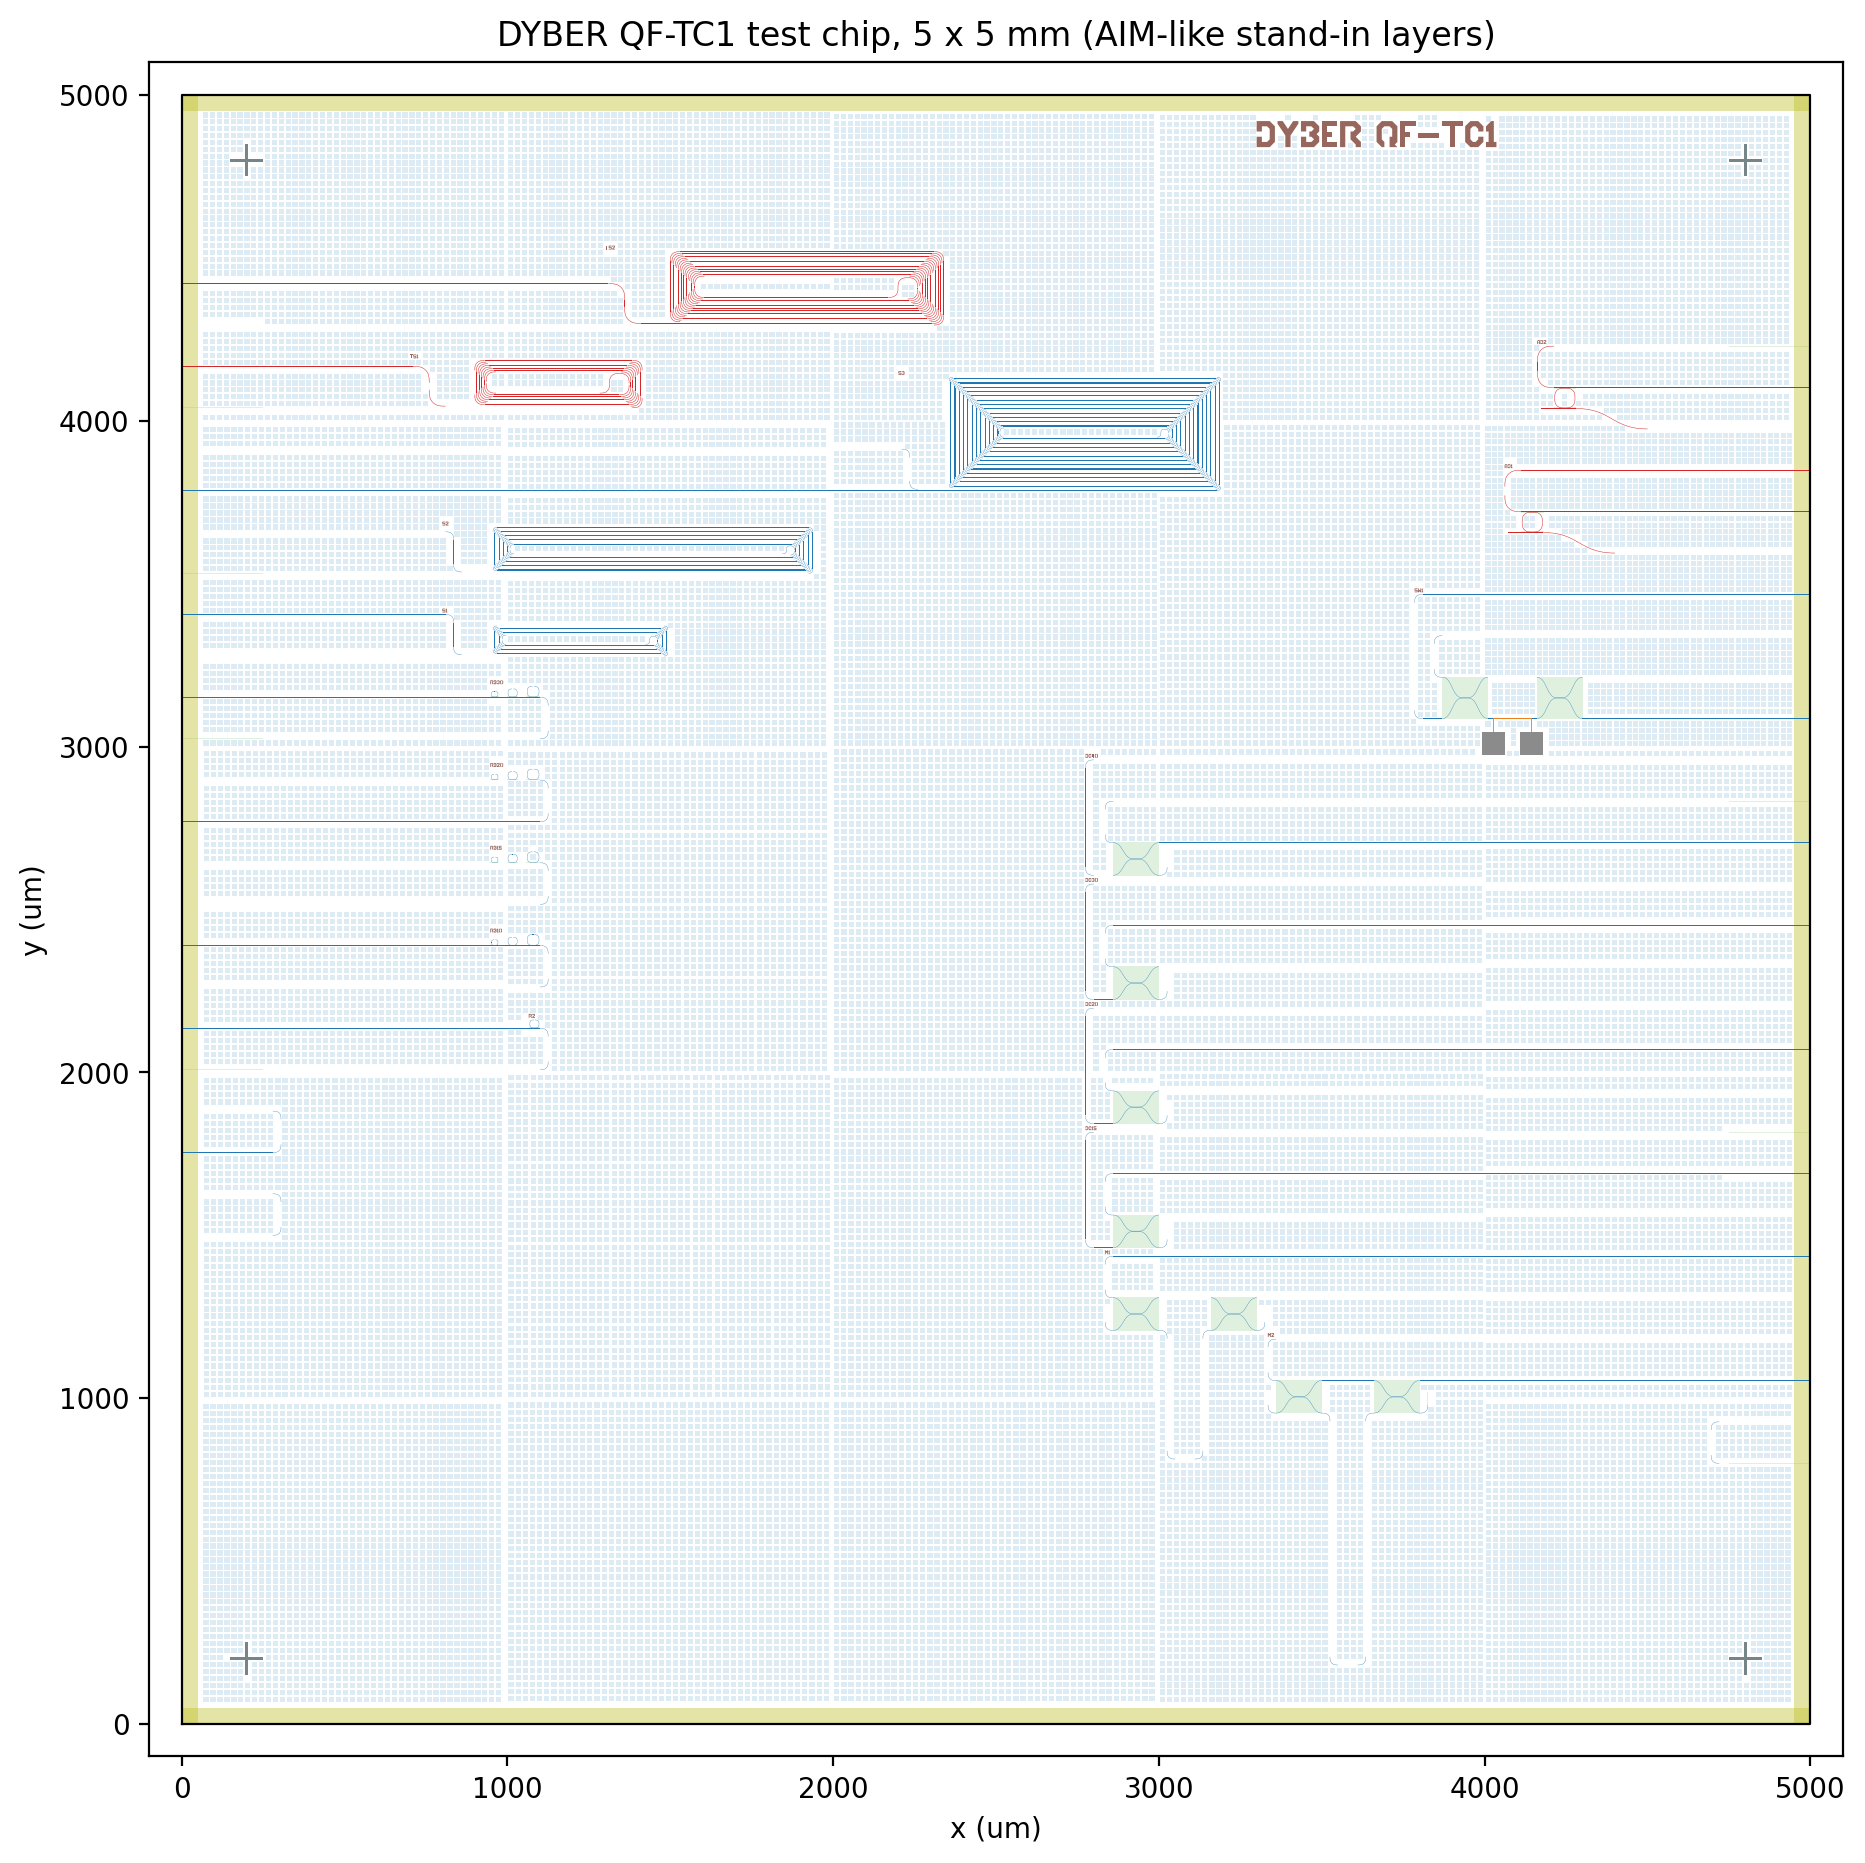
QF-TC1 is a 5x5 mm validation chip with 22 structures, DRC clean at 0 violations. Each structure maps to a specific simulation claim it is built to measure on silicon, so the chip is a checklist for the physics, not a generic test die. It is drawn on a foundry-neutral stand-in rule deck, and the layout has since been retargeted onto the production foundry PDK (GlobalFoundries 45SPCLO) with the design rules already satisfied.
Run the model yourself.
The same resource and noise model that powers the figures above ships in the SDK. Install it and print the device spec for an H-cat circuit.
pip install dyberfrom dyber import Dyber, Circuit
c = Circuit(2); c.h(0); c.cx(0, 1); c.measure_all()
dy = Dyber()
job = dy.backend("local_simulator").run(c, shots=1000)
print(job.result().resources)At the 0.5 percent per-cycle loss operating point this prints code distance 53 and 5,617 cats per logical, the same model that powers the Resource Analyzer on this site. The resource and noise models are open source in the dyberforge package.
The actual stack.
- QuTiP and Strawberry Fields : quantum optics, cross-checked against each other for cat fidelity.
- stim and PyMatching : circuit-level noise and decoding for the surface-code threshold.
- Meep and MPB : 3D electromagnetics and mode solving for the photonic structures.
- gdsfactory and KLayout : layout generation and DRC for the QF-TC1 test chip.